Breaking down poverty impacts by sex
PolicyEngine estimates the impact of customizable policy reforms on poverty — overall, by age, and now by sex.
Contents
Welcome to the latest blog post from PolicyEngine, where we share updates on our work to build free, open-source software that helps people understand the impact of public policies. We’re excited to announce an additional feature for our existing tax and benefit reform calculator that enables users to estimate how customizable tax and benefit reforms affect the poverty rate, split by sex.
Since our inception, we’ve shown how customizable policy reforms would affect the poverty rate, overall and by age group. We model impacts using the Supplemental Poverty Measure (SPM), which the Census Bureau
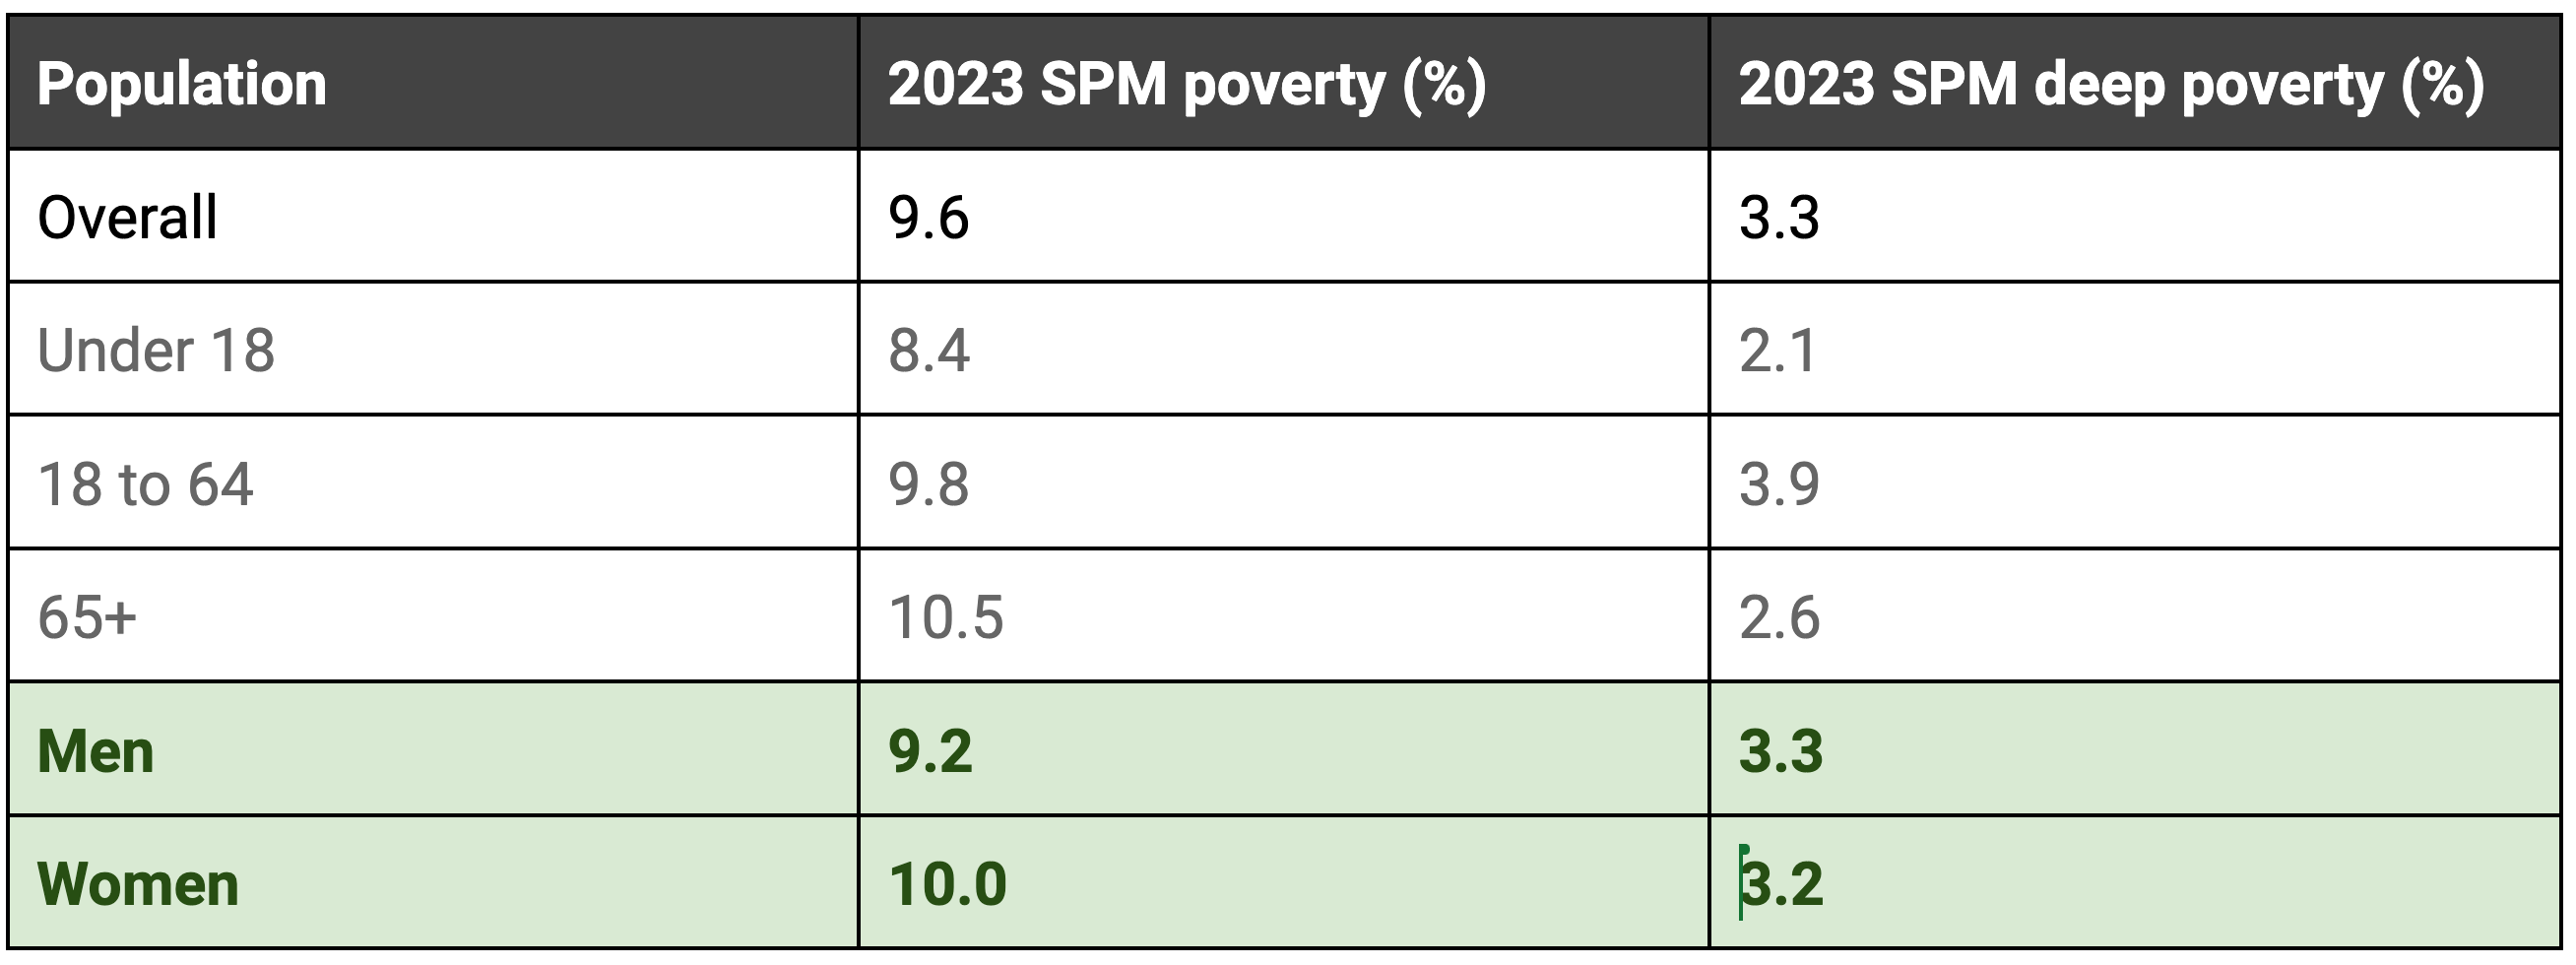
We estimate that, under current law, 9.6% of the population has resources below their poverty threshold, and 3.3% has resources below half their poverty threshold (deep poverty). Women face higher poverty rates than men, and children face higher poverty rates than working-age adults, who face higher poverty rates than seniors. These poverty trends resemble those in the
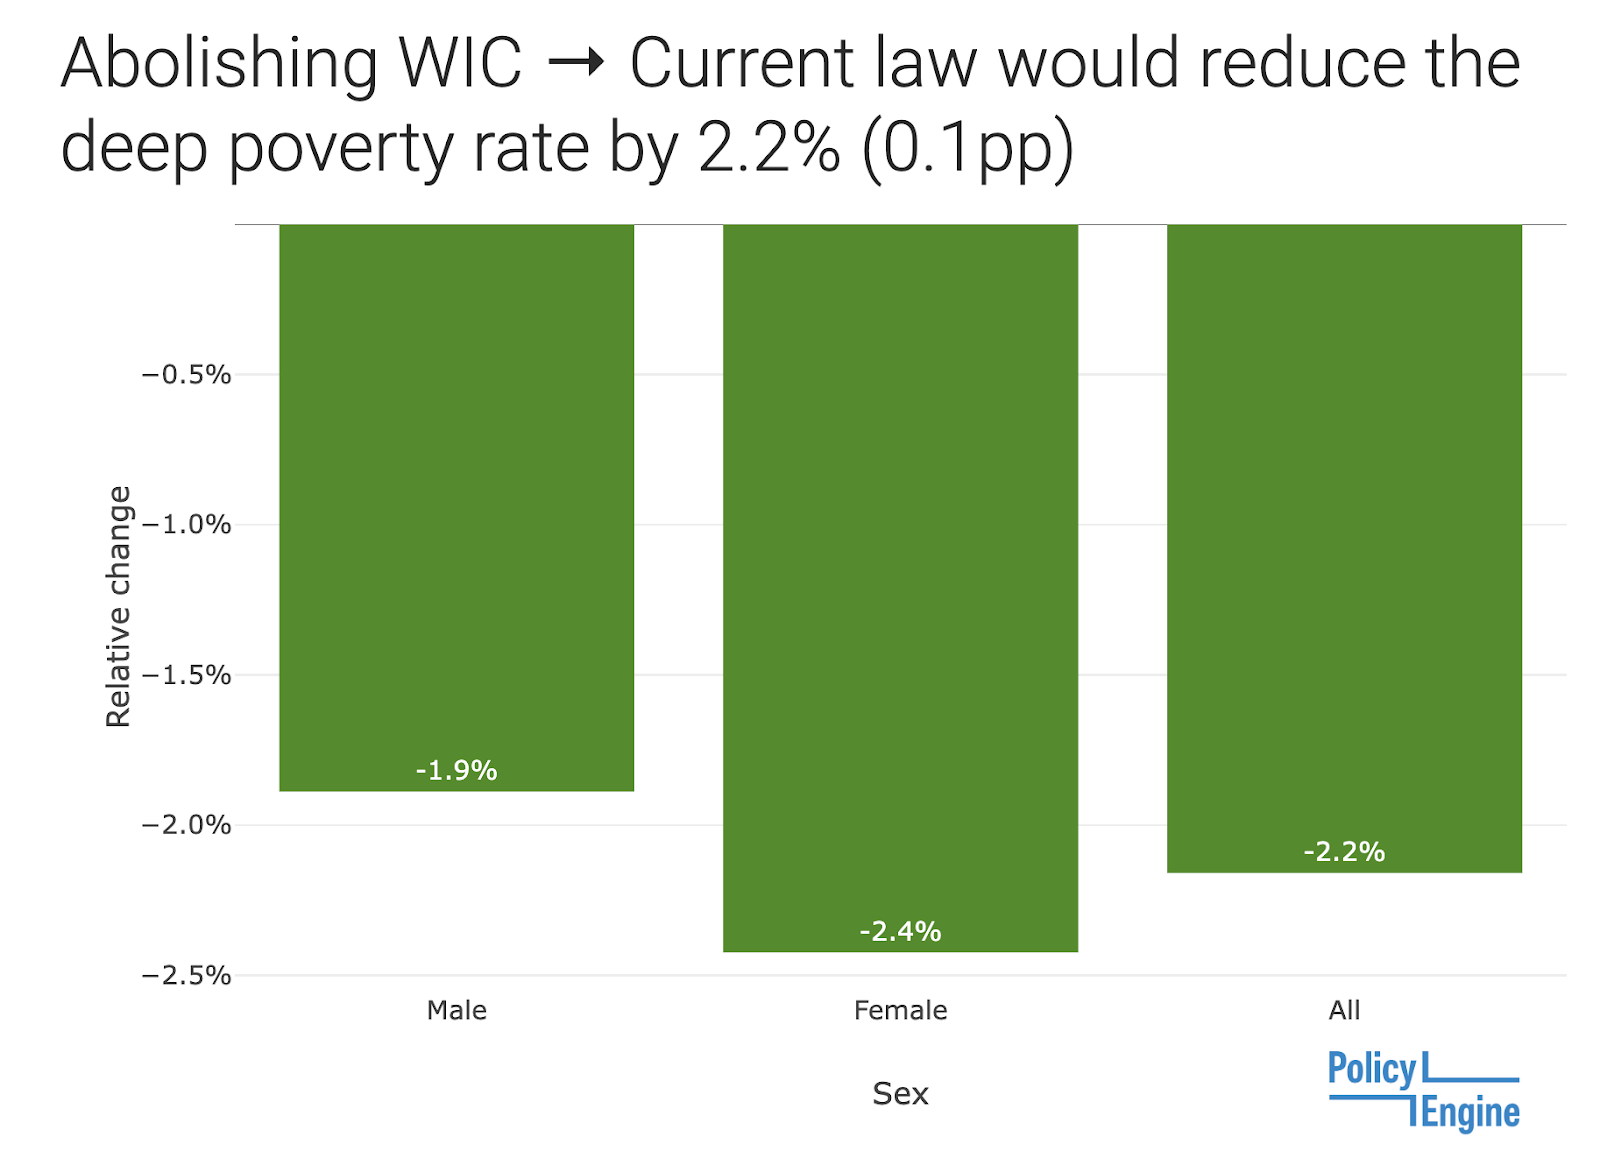
Let’s consider an example to illustrate the power of our updated tool. Suppose we want to estimate the poverty impact of the Special Supplemental Nutrition Program for Women, Infants, and Children (WIC), which provides nutrition assistance to low-income pregnant women, new mothers, and young children. With PolicyEngine, anyone can compare today’s poverty rate to a scenario without WIC — overall, by age group, and now by sex.
We estimate that WIC reduces poverty by 0.8% and deep poverty by 2.2%. Our pre-existing charts show that WIC disproportionately benefits children,
Our new charts show that
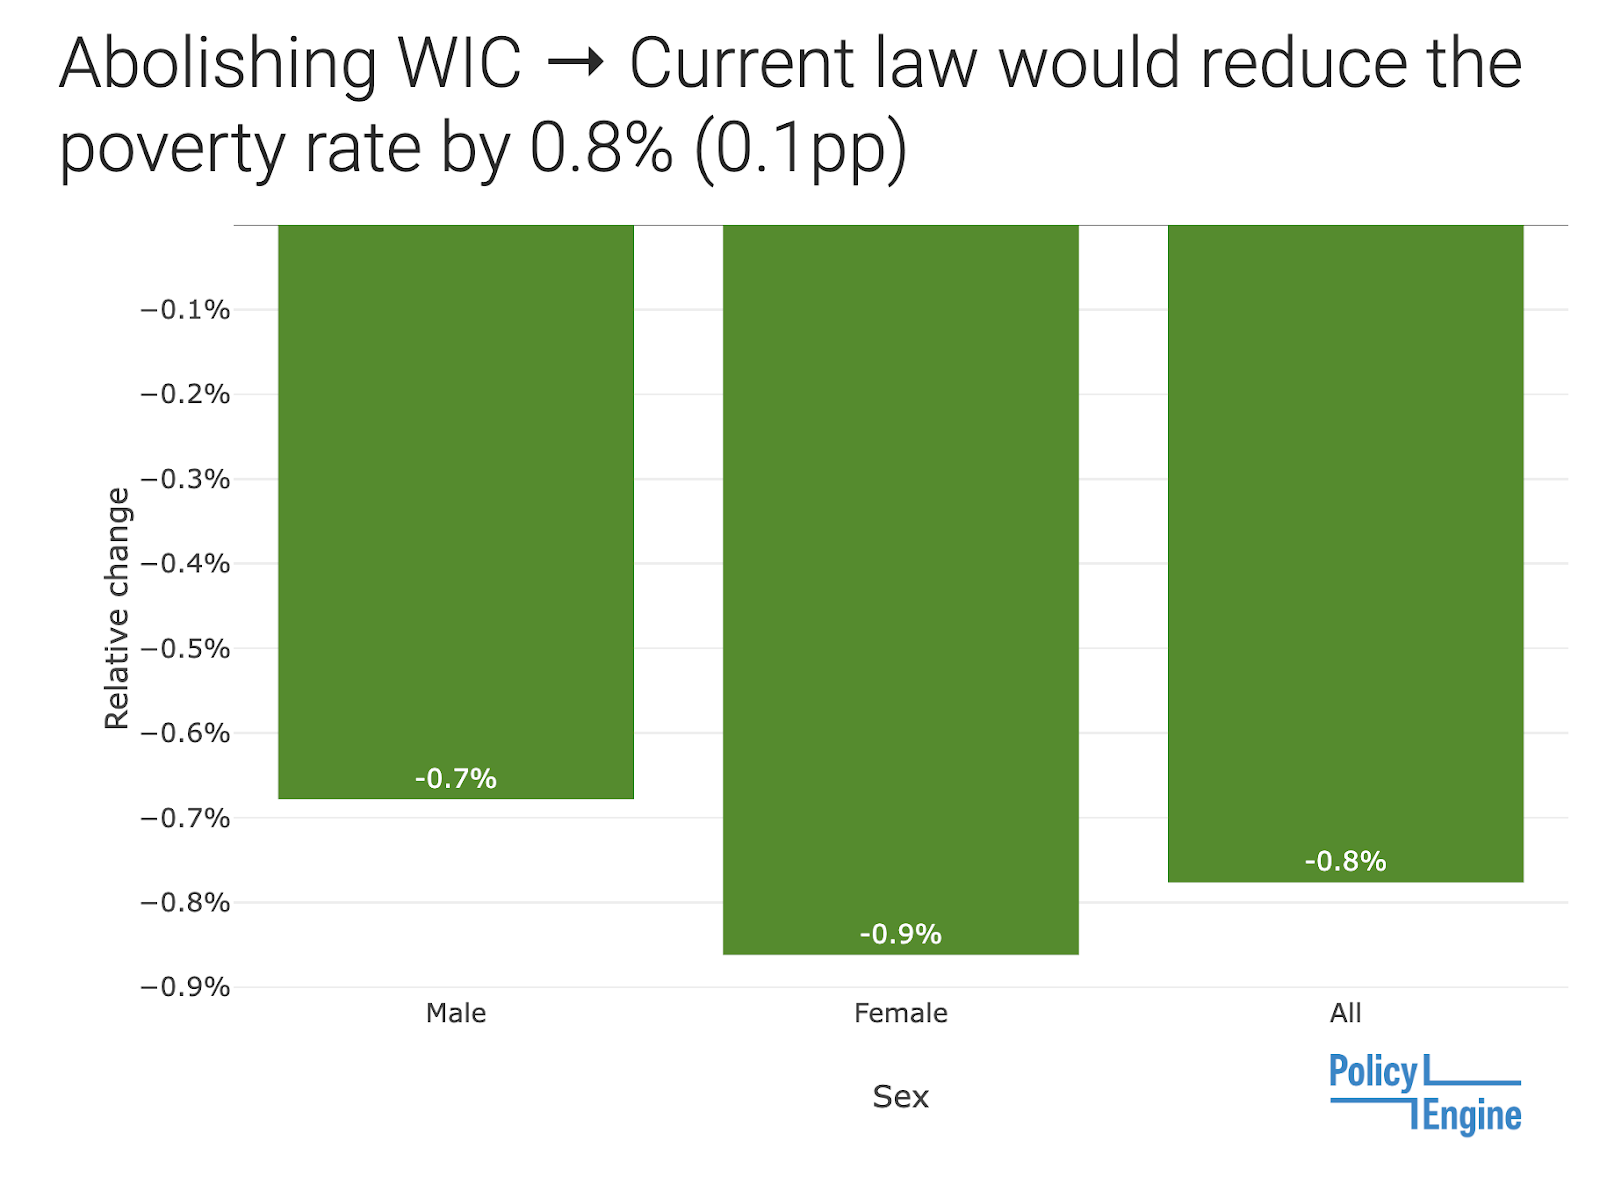
We also find that
Our updated tax and benefit reform calculator helps policymakers, researchers, and advocates better understand the impact of public policies on poverty rates, both overall and in deep poverty, for men and women. By providing policymakers with more accurate data on the impact of policy decisions, we can inform public discourse and facilitate evidence-based decision-making.

max ghenis
PolicyEngine's Co-founder and CEO

Subscribe to PolicyEngine
Get the latests posts delivered right to your inbox.
© 2025 PolicyEngine. All rights reserved.