How would reforms affect cliffs?
We've added a new feature to the US version of PolicyEngine that lets you see how your reforms affect cliffs.
Contents
Overview
How current law creates cliffs
How reforms affect cliffs for individual households
How reforms affect cliffs in aggregate
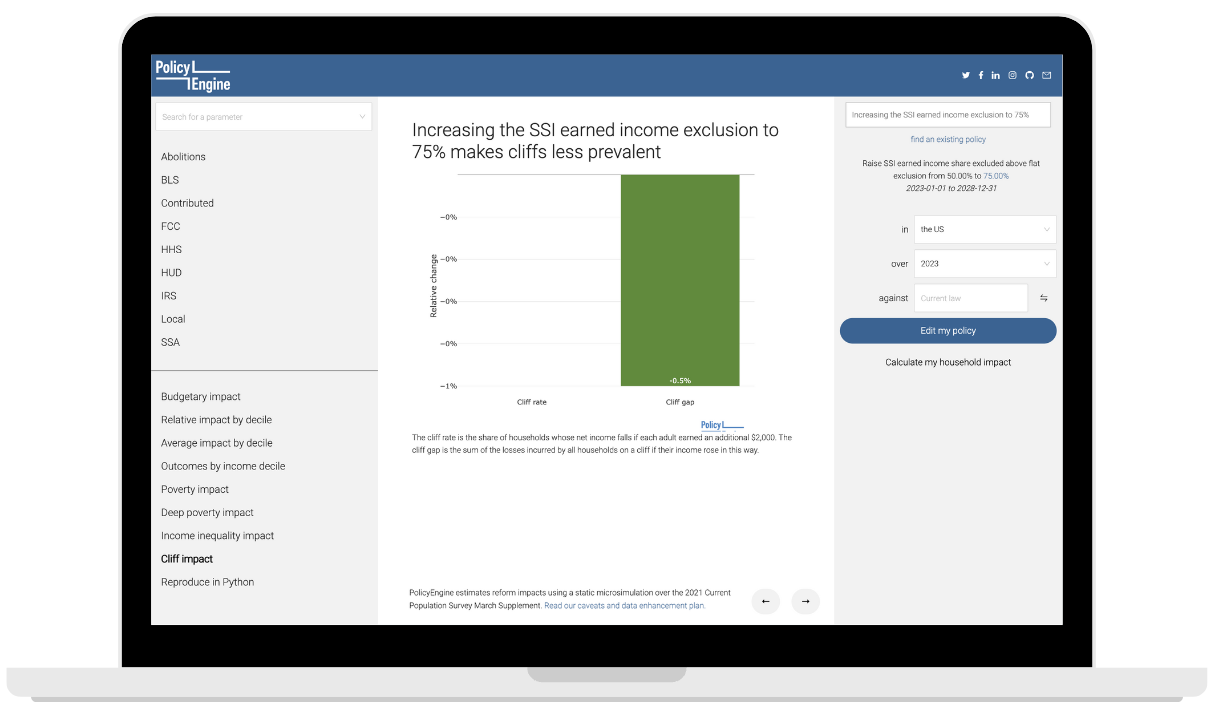
Increase the SSI earned income exclusion
Repeal SNAP emergency allotments
Start phasing out Washington’s Working Families Tax Credit at a lower income
Summary and future research
Appendix A: Alternative cliff definitions
Appendix B: PolicyEngine’s SSI microsimulation model
Appendix C: Other cliff research
We’re grateful to
Overview#
The cliff (a.k.a. benefit cliff or welfare cliff) is a phenomenon that occurs when an individual is worse off when their income rises, due to the government withdrawing benefits and/or levying taxes. Cliffs discourage individuals from working more hours or seeking a higher wage, and they have been a topic of concern in the US policy arena.
PolicyEngine now shows how policy reforms can avoid these cliffs. Our free and open source web app uses a comprehensive microsimulation model to compute the effects of customizable tax and benefit reforms on society and individual households.
With the
This post examines the impact of current policy on the creation of cliffs at the household and population levels. The post also discusses how we measure the prevalence and severity of cliffs and presents a series of three policy experiments designed to reduce their occurrence. These experiments can provide valuable insights into the effectiveness of different reform measures and help the policy community develop more effective strategies for addressing cliffs.
How current law creates cliffs#
Users can enter their household information at

Users can also view a chart of their
We also express cliffs as spikes in the
How reforms affect cliffs for individual households#
PolicyEngine US lets users adjust hundreds of policy parameters governing federal and state tax and benefit programs. For example,

After specifying a policy reform, the net income and marginal tax rate charts show two lines each: one for baseline (gray), and one for reform (blue). The net income chart also shows two sets of earnings dead zones in different shadings.

For this single parent of a blind child in New York, the SSI reform would not affect their net income or marginal tax rate at their current $20,000 earnings. But as they earn more, the reform would increase their SSI and phase it out over a longer earnings range. As a result, their marginal tax rate falls, and then rises once they reach an earnings level where it would have otherwise fully phased out.
In addition to changing marginal tax rates, the SSI reform would push the cliff from around $44,000 earnings to about $88,000 earnings. The cliff results from SNAP, for which SSI provides categorical eligibility.
This example shows that even at the individual level, even simple reforms can affect cliffs in multiple ways. For example, since this SSI reform removes cliffs for some households and creates them for others, how can we determine the net effect? To answer this question, we need a population-level perspective.
How reforms affect cliffs in aggregate#
We have added the following measures and charts:
-
Cliff rate: Share of households who would be worse off if each adult earned $2,000 more per year
-
Cliff gap: Total net income lost by households when adults earn an additional $2,000
We selected a $2,000 increment to capture plausible margins for labor supply decisions: $2,000 is roughly a $1 per hour raise for full-time workers, or one hour per workday at the federal minimum wage of $7.25 per hour. Tax analysis often applies a smaller increment, such as $1, but this will only capture cliffs in hypothetical charts, not sparser microdata. The Department of Health and Human Services’s Marginal Tax Rate series measures cliffs with $2,000 increments. See Appendix A for exploration of other increments and approaches.
We use the cliff nomenclature because both tax and benefit programs can create cliffs, and sometimes they interact to create cliffs that wouldn’t appear in the tax or benefit system alone. The cliff rate and cliff gap terms mirror the established poverty rate (share of people below the poverty line) and poverty gap (total amount below the poverty line across all people in poverty) terms.
Currently, we estimate that 0.5% of households face a cliff in 2023, producing a total cliff gap of $5.0 billion. In 2022, 1.7% of households faced a cliff, producing a cliff gap of $18.5 billion. The repeal of SNAP emergency allotments, scheduled for March 2023, reduces the prevalence of cliffs in 2023, as we discuss more below.
We can now answer the question we previously posed: given our SSI reform creates some cliffs and removes others, how does it affect total cliffs?
As some background, Supplemental Security Income (SSI) is a cash assistance program for low-income seniors and people with disabilities administered by the Social Security Administration (SSA). For eligible people, the SSA calculates SSI as the difference between a maximum benefit and “countable income”. Above flat thresholds, each dollar of earned income is counted as 50 cents of countable income, meaning it creates a 50% marginal tax rate in the phase-out range.
Increasing the earned income exclusion to 75% effectively reduces SSI’s MTR to 25%. While this would not affect the cliff rate, it would reduce the cliff gap by 0.5%.

See Appendix B for caveats around PolicyEngine’s SSI microsimulation model.
Throughout the pandemic, several states have expanded the Supplemental Nutritional Assistance Program (SNAP) to provide the maximum benefit to eligible households, or an increase of at least $95 per month. While SNAP normally has a cliff due to a minimum allotment ($23 per month in 2023), the emergency allotments significantly expanded the cliff by effectively increasing the minimum allotment to the maximum allotment.
The Consolidated Appropriations Act of 2023 repealed the SNAP emergency allotments, effective March 2023. We have modeled that (
Repealing the SNAP emergency allotments for January and February 2023 would cut the cliff rate by 34%, from 0.5% to 0.3%, and reduce the cliff gap 14.9%, from $5.0 billion to $4.3 billion.

In 2022, when states provided SNAP emergency allotments throughout the year, they had a larger impact on cliffs. Repealing emergency allotments would have cut the cliff rate 91%, from 1.7% to 0.2%, and cut the cliff gap 94%, from $18.5 billion to $1.1 billion.

Washington’s provides a refundable Working Families Tax Credit, with the amount and structure depending on household size. It starts phasing out at an amount below the end of the federal Earned Income Tax Credit: $2,500 below for families with one child, and $5,000 below for those with multiple children. This creates
Phasing out the credit over a longer interval would increase MTRs for those newly in the phase-out region, and reduce MTRs for those already with earnings in the phase-out region. On a net basis, PolicyEngine finds that enlarging the phase-out region to $10,000 would have no effect on Washington’s cliff rate; however, it would lower Washington’s cliff gap by 0.4%, from $186.0 million to $185.2 million.

Summary and future research#
Government agencies and nonprofits have expanded their research into cliffs in recent years, as we summarize in Appendix C. We now provide a novel contribution to the cliff conversation: quantitative estimates of their prevalence under highly customizable reforms, alongside budgetary and distributional outcomes.

Impacts of selected reforms on cliffs and other outcomes
However, our cliff measures are only as complete as our microsimulation model. Since we do not yet capture all tax and benefit programs (for example, childcare subsidies, housing subsidies, and state income taxes in most states), we under-report cliffs. Our
Our policy experiments show that cliffs can be averted by making programs either more generous (increasing the SSI earned income exclusion) or less generous (repealing SNAP emergency allotments and phasing out Washington’s Working Families Tax Credit at lower incomes). In these instances, though, reforming programs with explicit cliffs had a much larger impact on cliff prevalence than reforming marginal tax rates.
As the policy community crafts policies to achieve other goals, such as budgetary constraints or poverty alleviation, they now have the tools to consider the incentive issues around cliffs as well.
Appendix A: Alternative cliff definitions#
We considered two dimensions of alternatives for cliffs:
-
Earnings increment
-
Grouping of people and households
We initially proposed reporting the share of adults whose net income would fall with an additional $2,000 of earnings. Further investigation revealed that reporting the share of adults would add to the PolicyEngine runtime by multiple times, since we would have to recompute a household’s net income under each adult’s increment independently. Instead, we chose to determine cliffs at the household level upon each adult increasing their earnings simultaneously.
The increment affects the resolution of the cliffs. If the increment is too low, too few households will be just below the cliff in order to experience it. If the increment is too high, it won’t capture smaller cliffs, as households will earn enough to get out of them.
While we did not intend to select a threshold as to maximize cliffs and gaps, we consulted the evidence to decide whether to stray from our original plan. Since cliffs in 2022 peaked at increments around $2,000-$3,000, we kept our original $2,000 increment.


We also considered whether to “pool” the earnings increment, i.e. to divide it across all adults in the household rather than increase each adult’s by that amount. This approach pushes the peak cliff rates and gaps to $6,000.


Since pooling the earnings increment adds complexity without producing an obvious benefit, we opted not to pool them.
These numbers differ slightly from the current baseline cliff values for 2022, as we produced them with an earlier version of the model.
Appendix B: PolicyEngine’s SSI microsimulation model#
The Social Security Administration determines eligibility for SSI based on four factors:
-
Age
-
Disability
-
Income
-
Assets
PolicyEngine uses the Current Population Survey for microsimulation modeling. Of these factors, the CPS only has reliable information on age and income. CPS respondents report difficulties across six areas, including vision, and they do not report assets.
Modeling SSI in reforms requires assigning eligibility independent of whether a respondent reported receiving SSI. For example, if a reform increases income eligibility limits (as in Experiment 1 here), we need to estimate whether a respondent would be newly eligible.
We assign SSI eligibility stochastically using the following algorithm:
-
Assign blindness to respondents who report vision difficulty in the CPS.
-
Assign disability to respondents who report any difficulty in the CPS.
-
Calculate the share of the ABD (aged, blind, or disabled) population that would meet other SSI requirements except for income, such as asset limits and disability certification, as well as take-up conditional on eligibility, in order to match the SSA’s total SSI enrollment records. We estimate that 59% of the ABD population would participate in SSI based on non-income-based eligibility requirements and take-up.
-
Assign SSI eligibility randomly to 59% of the ABD population.
Appendix C: Other cliff research#
Beyond PolicyEngine, several organizations have studied cliffs:
-
The Department of Health and Human Services’s
Marginal Tax Rate Series -
The Congressional Budget Office’s study on
Effective Marginal Tax Rates -
The Atlanta Fed’s
CLIFF Dashboard -
ImagineLA ’sSocial Benefit Navigator for Los Angeles, using theBenefitKitchen API -
CrossPurpose ’s cliff dashboard -
Georgia Center for Opportunity ’sBenefitsCliffs.org calculator -
Leap Fund ’sBenefitsCliff.com resource

max ghenis
PolicyEngine's Co-founder and CEO

nikhil woodruff
PolicyEngine's Co-founder and CTO

Subscribe to PolicyEngine
Get the latests posts delivered right to your inbox.
© 2025 PolicyEngine. All rights reserved.