How Would Each Presidential Candidate’s Economic Plans Affect Your Household?
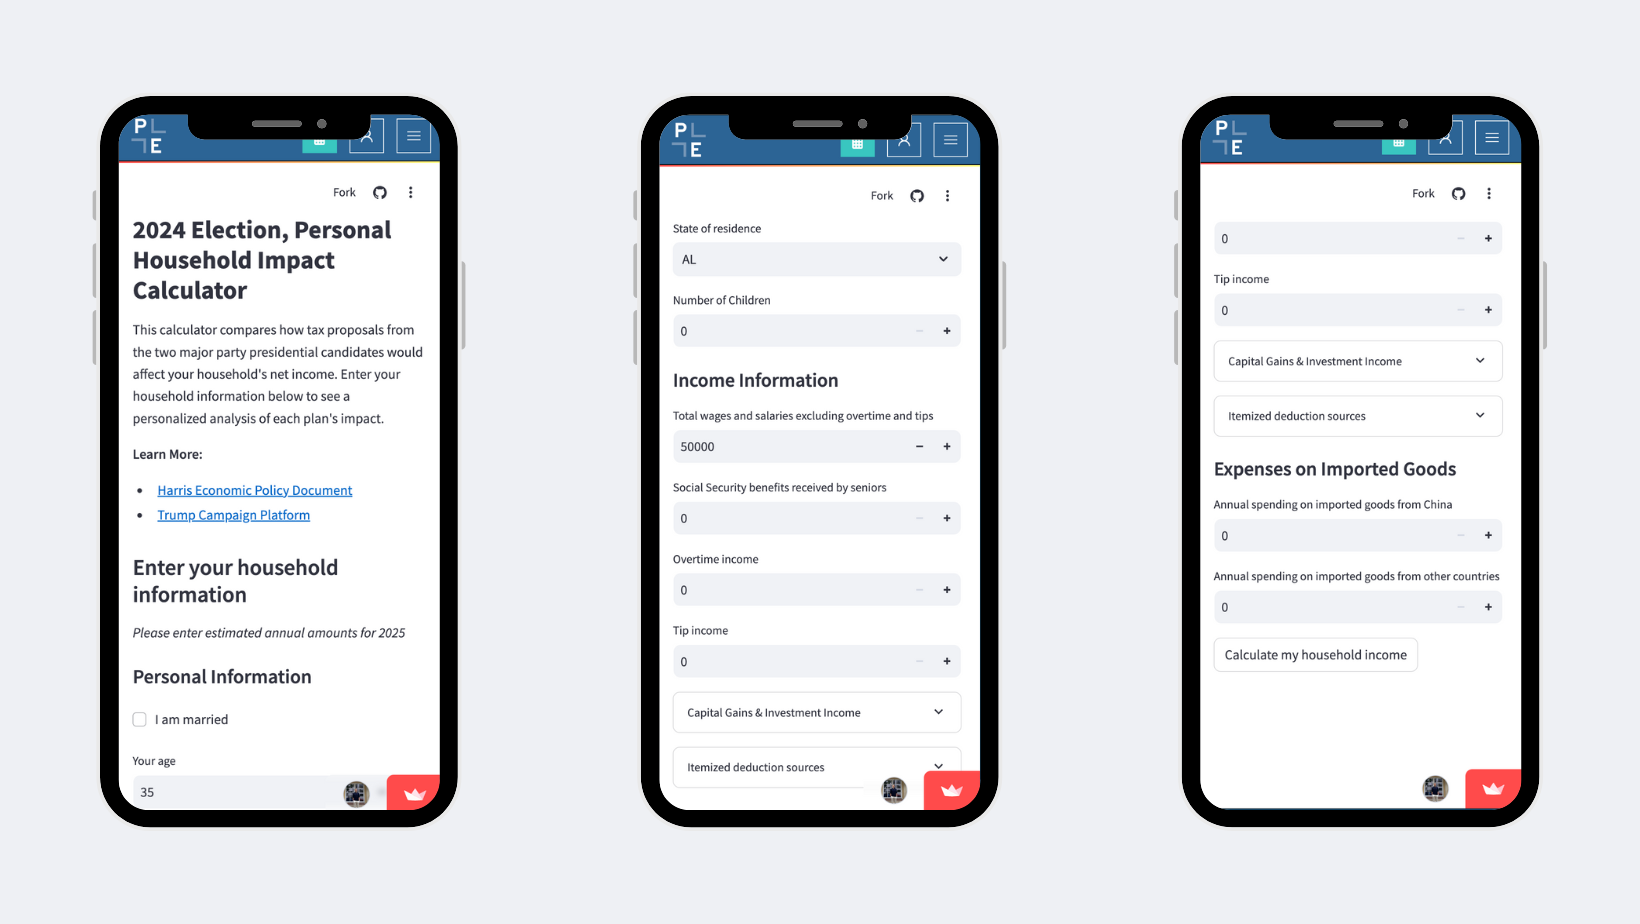
PolicyEngine has created a personalized calculator for the 2024 presidential election’s tax proposals.

Contents
A young family in Minnesota
A semi-retired couple in Florida
A professional family in New York City
A high-net-worth individual in California
Key takeaways
Calculate your household’s results
Try our
Read on for a few examples of our new tool in action.
A young family in Minnesota#
Consider a married couple, both 35, with two young children ages 4 and 7. Here are their details:

Based on

Under Vice President Harris’s proposed policies, this family would see their net income increase by $2,600 to $57,777, driven by the expanded Child Tax Credit. Their federal refundable credits would increase from $5,039 to $9,639, as you can view in detail in the Federal Credits tab of the right hand table.
Under President Trump’s proposed policies, their net income would decrease by $3,160 to $52,017, due to the impact of new tariffs on imported goods. While the plan includes provisions like making overtime and tip income tax-exempt, this family doesn’t have income in those categories to offset the tariff costs.
A semi-retired couple in Florida#
Our second example is a semi-retired couple, both 68, living in Florida. They receive $45,000 in Social Security benefits and earn additional income through part-time work ($20,000 in regular wages, $8,000 in tips, and $4,000 in overtime). They spend $1,000 annually on Chinese goods and $5,000 on other foreign products.

Under Trump’s proposed policies, this couple would see their net income increase by $578 to $74,370. The tax exemptions on their tip and overtime income, along with changes to Social Security taxation, outweigh the impact of new tariffs. Their income tax before credits would decrease from $3,208 to $1,530.
Under Harris’s policies, their net income would remain unchanged at $73,792, as her reforms target different demographic groups and income levels.
A professional family in New York City#
Our third example examines a married couple, both 45, with one child age 12, living in New York City. Their financial profile:


Harris’s policies would increase their net income by $1,000 to $116,790, through expanded child tax benefits. Trump’s policies would decrease their net income by $1,132 to $114,658, with tariff costs outweighing the benefits from the state and local tax (SALT) deduction cap removal.
A high-net-worth individual in California#
Our final example is a single 55-year-old living in California with investment income. Their income includes:
-
Wages: $100,000
-
Capital gains: $800,000
-
Qualified dividends: $20,000
-
Non-qualified dividends: $5,000
-
Rental income: $24,000
-
Import spending: $2,000 Chinese goods, $10,000 other foreign goods

Under Trump’s policies, their net income would increase by $28,114 to $571,473. This change comes from the removal of the SALT deduction cap, which reduces tax liability in high-tax states like California.
Under Harris’s policies, their net income would decrease by $7,479 to $571,473, due to changes to capital gains taxation for high-income households.
Key takeaways#
These examples show how each candidate’s proposals affect households differently based on:
-
Family composition and age
-
Sources and levels of income (wages, investments, tips, overtime, Social Security)
-
State of residence and local tax burden
-
Spending patterns on imported goods (the U.S. imported
$427 billion in goods from China and$3.1 trillion in total goods in 2023) -
Eligibility for tax credits
The examples demonstrate impacts ranging from changes of a few hundred dollars to tens of thousands of dollars.
Calculate your household’s results#
Try our
Note: All calculations use projected 2025 tax parameters and currently available policy proposals. The calculator uses the PolicyEngine US microsimulation model and updates as new policy details emerge. Actual impacts could vary based on final policy design, implementation timeline, and behavioral responses (such as changes in import spending patterns in response to tariffs).

max ghenis
PolicyEngine's Co-founder and CEO

pavel makarchuk
Economist at PolicyEngine

Subscribe to PolicyEngine
Get the latests posts delivered right to your inbox.
© 2025 PolicyEngine. All rights reserved.