The new PolicyEngine US Population Impact page
You design the policy. We compute the poverty, inequality, and budgetary impacts.

Since we
Case study: the End Child Poverty Act#
As a case study, consider the
The Population Impact page starts with a disclaimer about the data (see the *Caveats *section of this post below), as well as some high-level measures of the reform’s impact.

Next is a breakdown of the budgetary impact, showing that the ECPA’s $242 billion net cost comprises $347 billion in benefit outlays, less $104 billion in tax revenues (in this case, repealed tax credits).

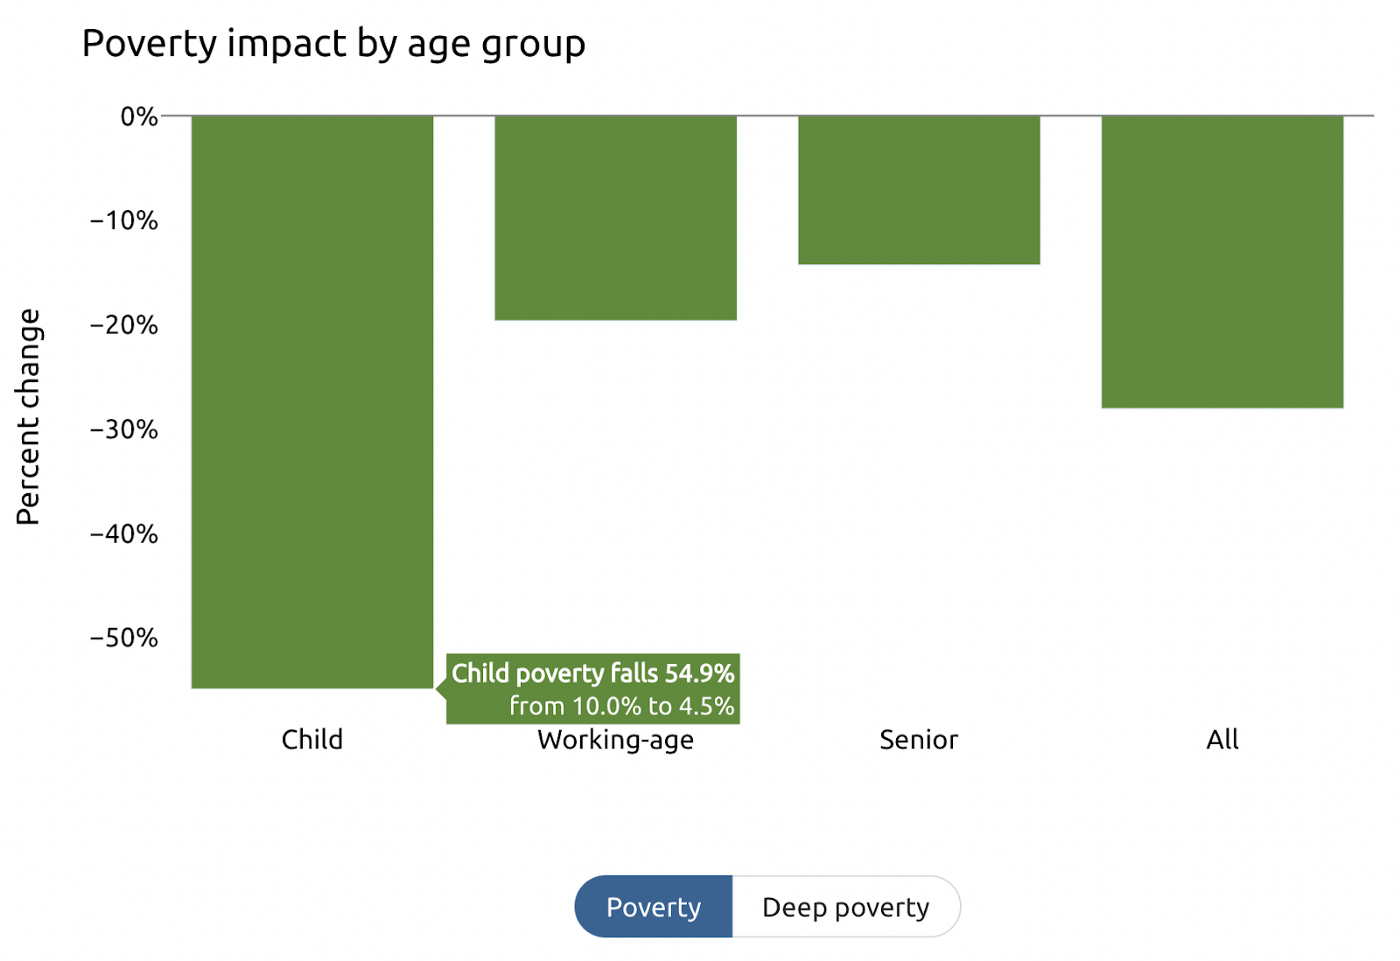
Next, we show the impact on poverty by age group, using the

We then show a common distributional chart: the average impact by income decile. Switch from relative to absolute to see the impact in dollars rather than a percent of the decile’s initial net income (after taxes and benefits).

While the above chart shows the average change, reforms rarely affect everyone in each decile equally. The following chart breaks down the members of each income decile based on whether the reform strongly increases or decreases their net income (5% or more), mildly increases or decreases their net income (less than 5%), or does not affect them.

Finally, the Population Impact screen shows how the reform affects three measures of income inequality: the

You can also see the
*Note: Our nationwide estimates of policy reforms keep state income taxes fixed at the values CPS respondents report. We simulate state income taxes only for state-specific analyses. The ECPA leaves some people worse off in the Massachusetts analysis because it repeals the EITC, which Massachusetts partially matches in its tax code.\
As always, users can view the reform’s personalized impact by selecting the
Caveats#
The PolicyEngine US Population Impact page uses the 2020 Current Population Survey (CPS) March Supplement, a representative household survey that powers many tax and benefit microsimulation analyses. The CPS covers many topics, from household structure and demographics to income and benefit receipt, but it has several drawbacks when it comes to microsimulation:
-
Truncated incomes. The CPS truncates high incomes for privacy. This means that PolicyEngine US will underestimate the magnitude of tax reforms affecting high earners.
-
Underestimated benefits. Aggregate benefits in the CPS fall short of administrative totals. We recalculate benefits from current rules for households that reported receiving them, which shrinks the gap, but PolicyEngine US still underestimates the magnitude of benefit reforms.
-
2020 data, 2022 policy. The latest CPS reflects households’ activity throughout calendar year 2020. PolicyEngine US currently applies 2022 tax and benefit policy to household information from 2020, which further underestimates incomes.
-
Lack of detail for more specific income types. For example, the CPS asks about total capital gains, so we currently assume that all are long-term.
-
Small sample sizes at the state level. The. For example, we currently have Massachusetts tax and benefit policy.
Next steps#
We are partnering with the
-
Impute missing data from other datasets. For example, we will impute filers’ short-term share of capital gains from the IRS Public Use File and household assets (which affect benefit eligibility) from the Survey of Consumer Finances, using our
synthimpute machine learning software. -
Augment income with synthetic imputations from the IRS Public Use File (PUF). The PUF is a restricted dataset containing a sample of scrubbed tax records. We will replicate tax units in the CPS and replace income data with imputed values from the PUF, preserving privacy while capturing the true distribution of income — especially at the high end.
-
Extrapolate data. We will apply government projections of earnings, prices, and population to extrapolate survey datasets, which often lag by a year or more, to the current year and over the ten-year budget window.
-
Reweight the data to better match administrative totals.
As we’ve done in PolicyEngine UK , we will ingest administrative totals across various dimensions — income, demographics, taxes, and benefits — and apply gradient descent to minimize the discrepancies against these targets. This step follows our stacking of the CPS atop the PUF-imputed CPS, allowing the optimizer to select and weigh the types of data sources that best model the US population and economy. -
Create enhanced datasets for each state. We will apply the above gradient descent methodology to the full CPS in each state, evening out the raw CPS’s volatile state-level estimates.
We’re excited to see what our users discover about the tax and benefit system by exploring this major new feature, and we can’t wait to make it even more accurate with these enhancements soon.

max ghenis
PolicyEngine's Co-founder and CEO

Subscribe to PolicyEngine
Get the latests posts delivered right to your inbox.
© 2025 PolicyEngine. All rights reserved.