Breaking down policy impacts by wealth decile
Income isn't everything.

Contents
How PolicyEngine breaks down by decile
Example: 1% land value tax
A UK mansion. Credit: DALLE-2.
Since our earliest days, we’ve broken the impact of policy reforms by income decile. For example, our
We’ve changed a lot in the past 18 months, but that chart remains one of the most important for conveying the distributional impact of a reform. We also show the impact in pounds, and the distributional impact *within *each income decile.
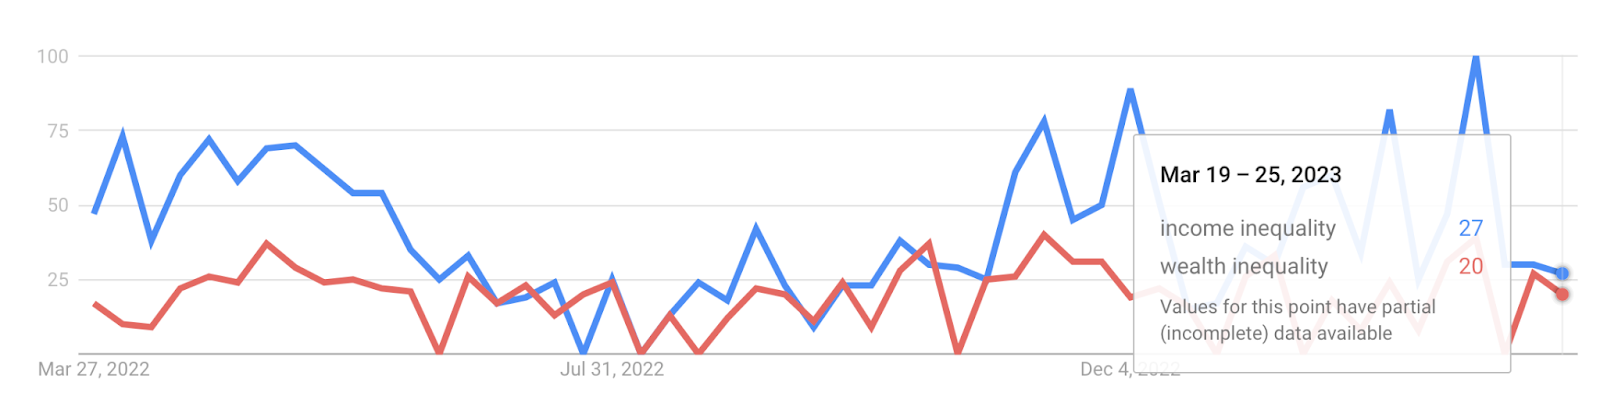
But income isn’t everything. The UK searched for “wealth inequality” about half as much as “income inequality” in
Reflecting this interest in wealth inequality, PolicyEngine UK now provides breakdowns by wealth decile as well as income decile.
How PolicyEngine breaks down by decile#
Our approach largely mirrors that of income grouping: we first sort UK households by their total wealth (including corporate and property wealth). We then partition this ordered set of households into ten groups of equal population size (this means that the groups might have different numbers of households, but the same number of people).
Corporate wealth includes the following:
-
Non-defined benefit pensions
-
Employee shares and options
-
Other UK shares
-
Investment ISAs
-
Unit investment trusts
Property wealth includes:
-
Primary residences
-
Non-primary residences
-
Non-residential property
PolicyEngine simulates policy reforms over a dataset of tens of thousands of households, based on the
Example: 1% land value tax#
Let’s explore a policy that affects income deciles differently than it affects wealth deciles: a land value tax. This policy taxes owners of land (including their residence) based on the value of the land, rather than the land and structure combined.
To see the impacts by decile for
-
Absolute impact by wealth decile: showing the absolute (£) average impacts by decile
-
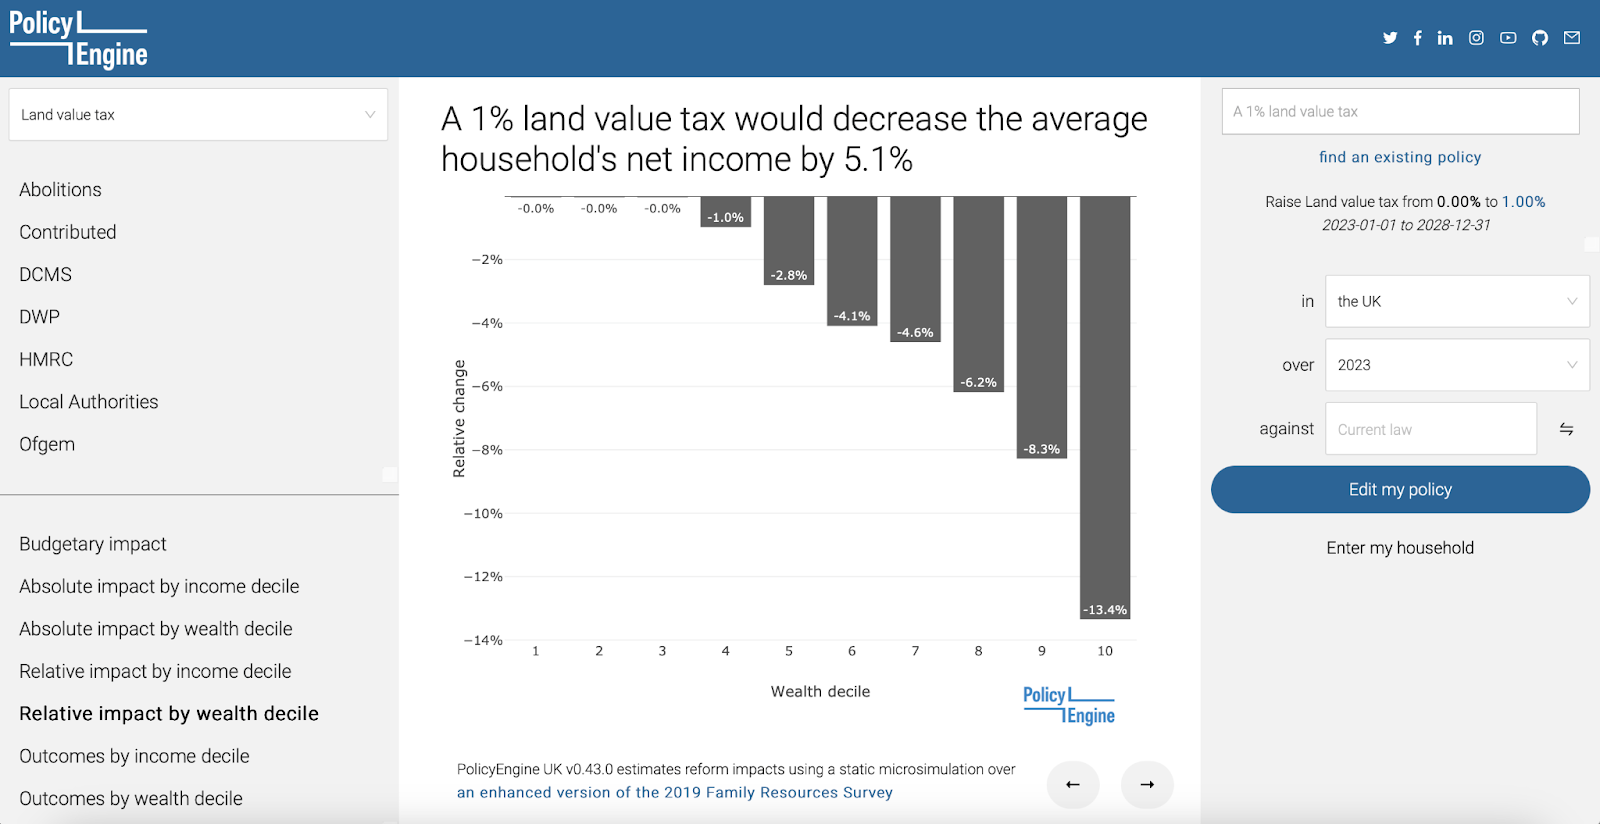
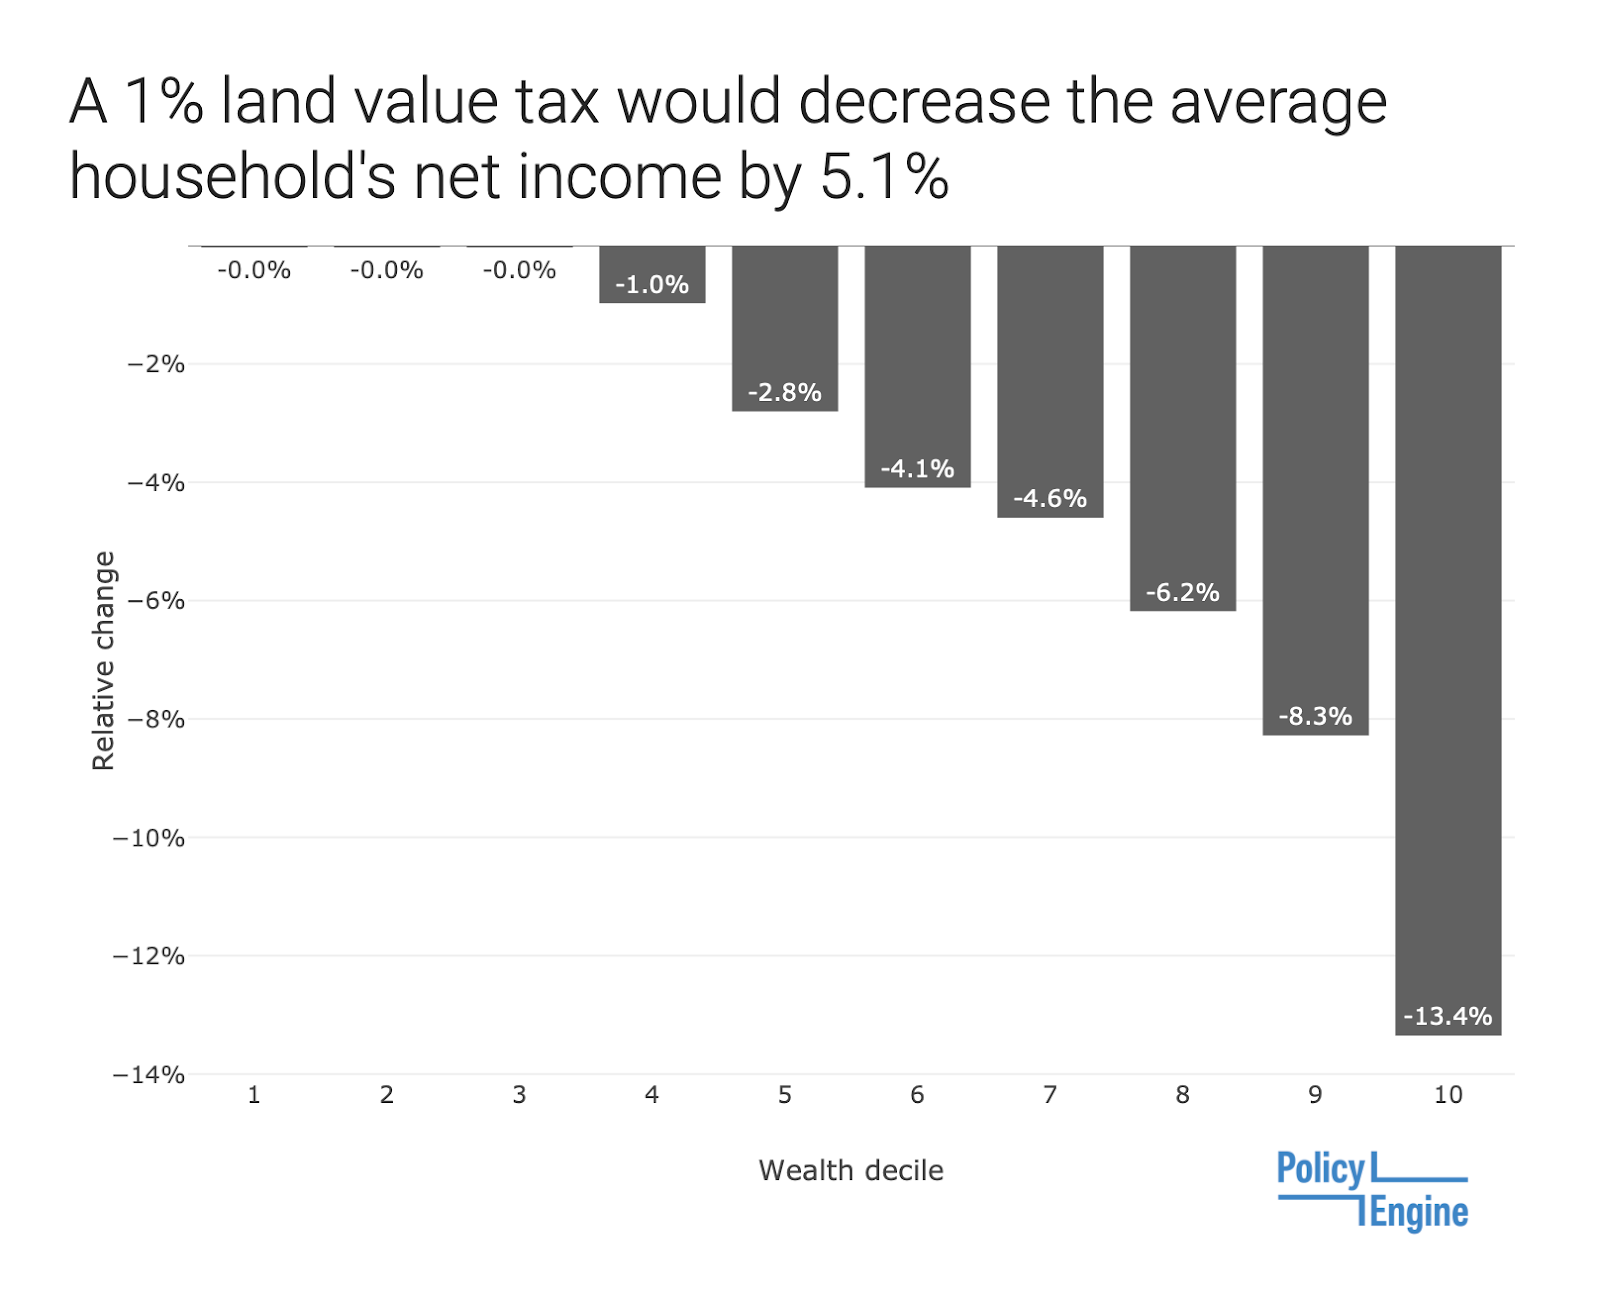
Relative impact by wealth decile: showing the impact as a percentage of income
-
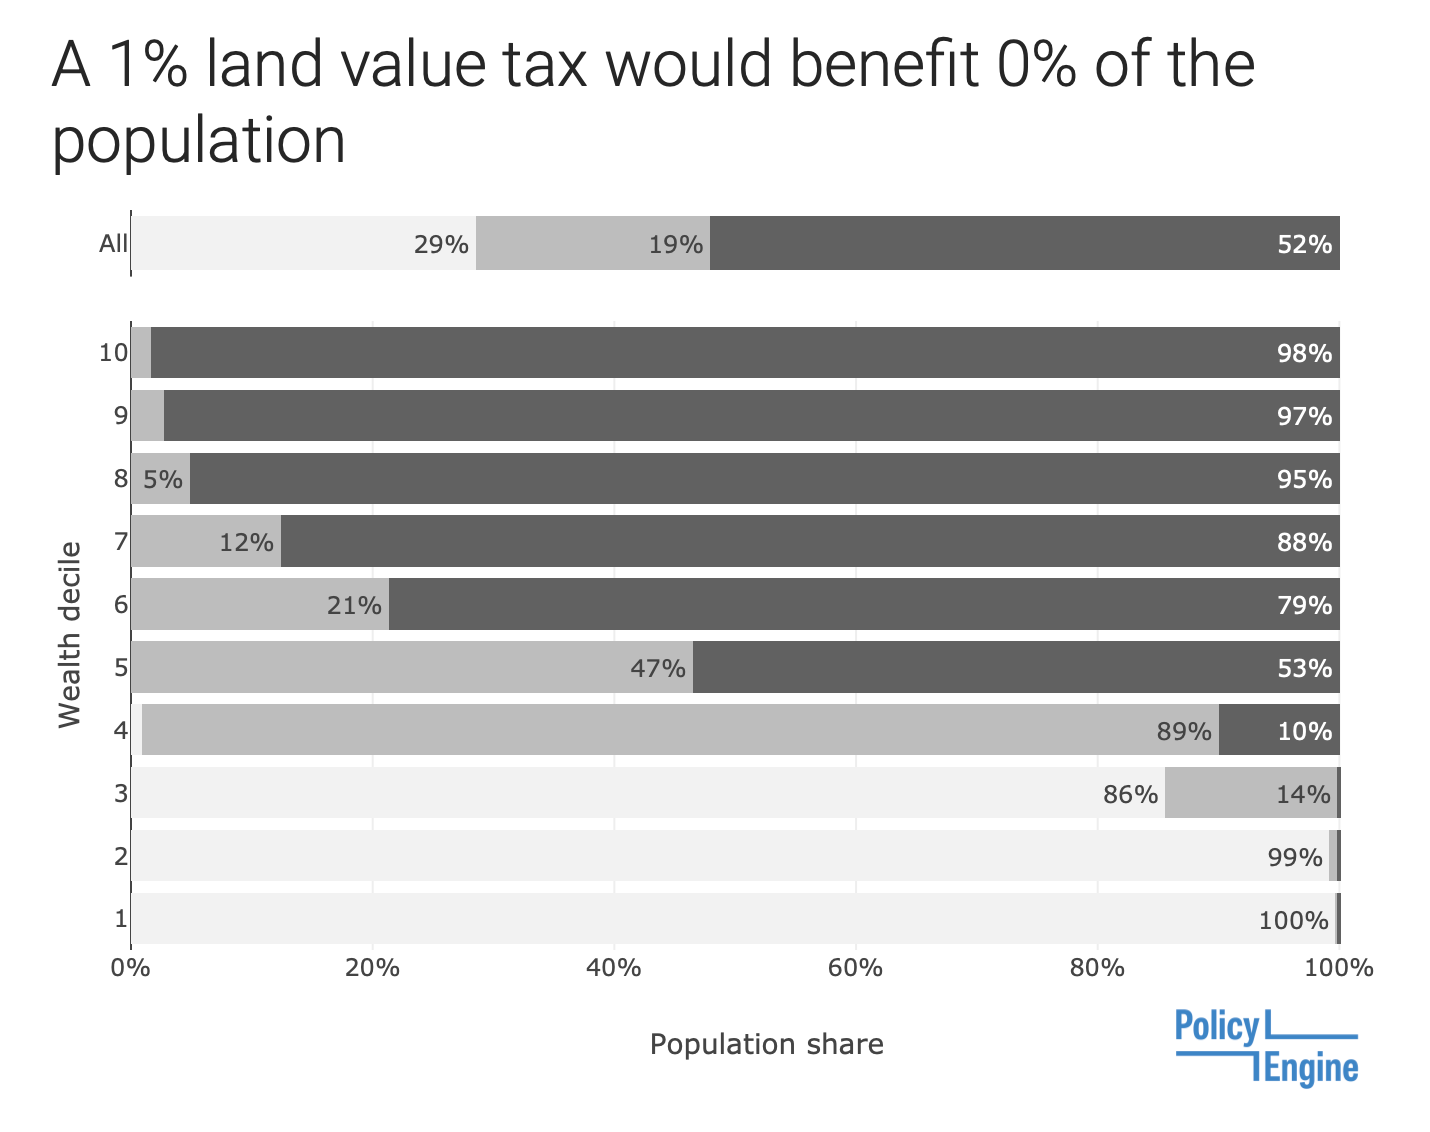
Outcomes by wealth decile: showing the distribution of outcomes within each wealth decile, in terms of how much it affects households’ net income
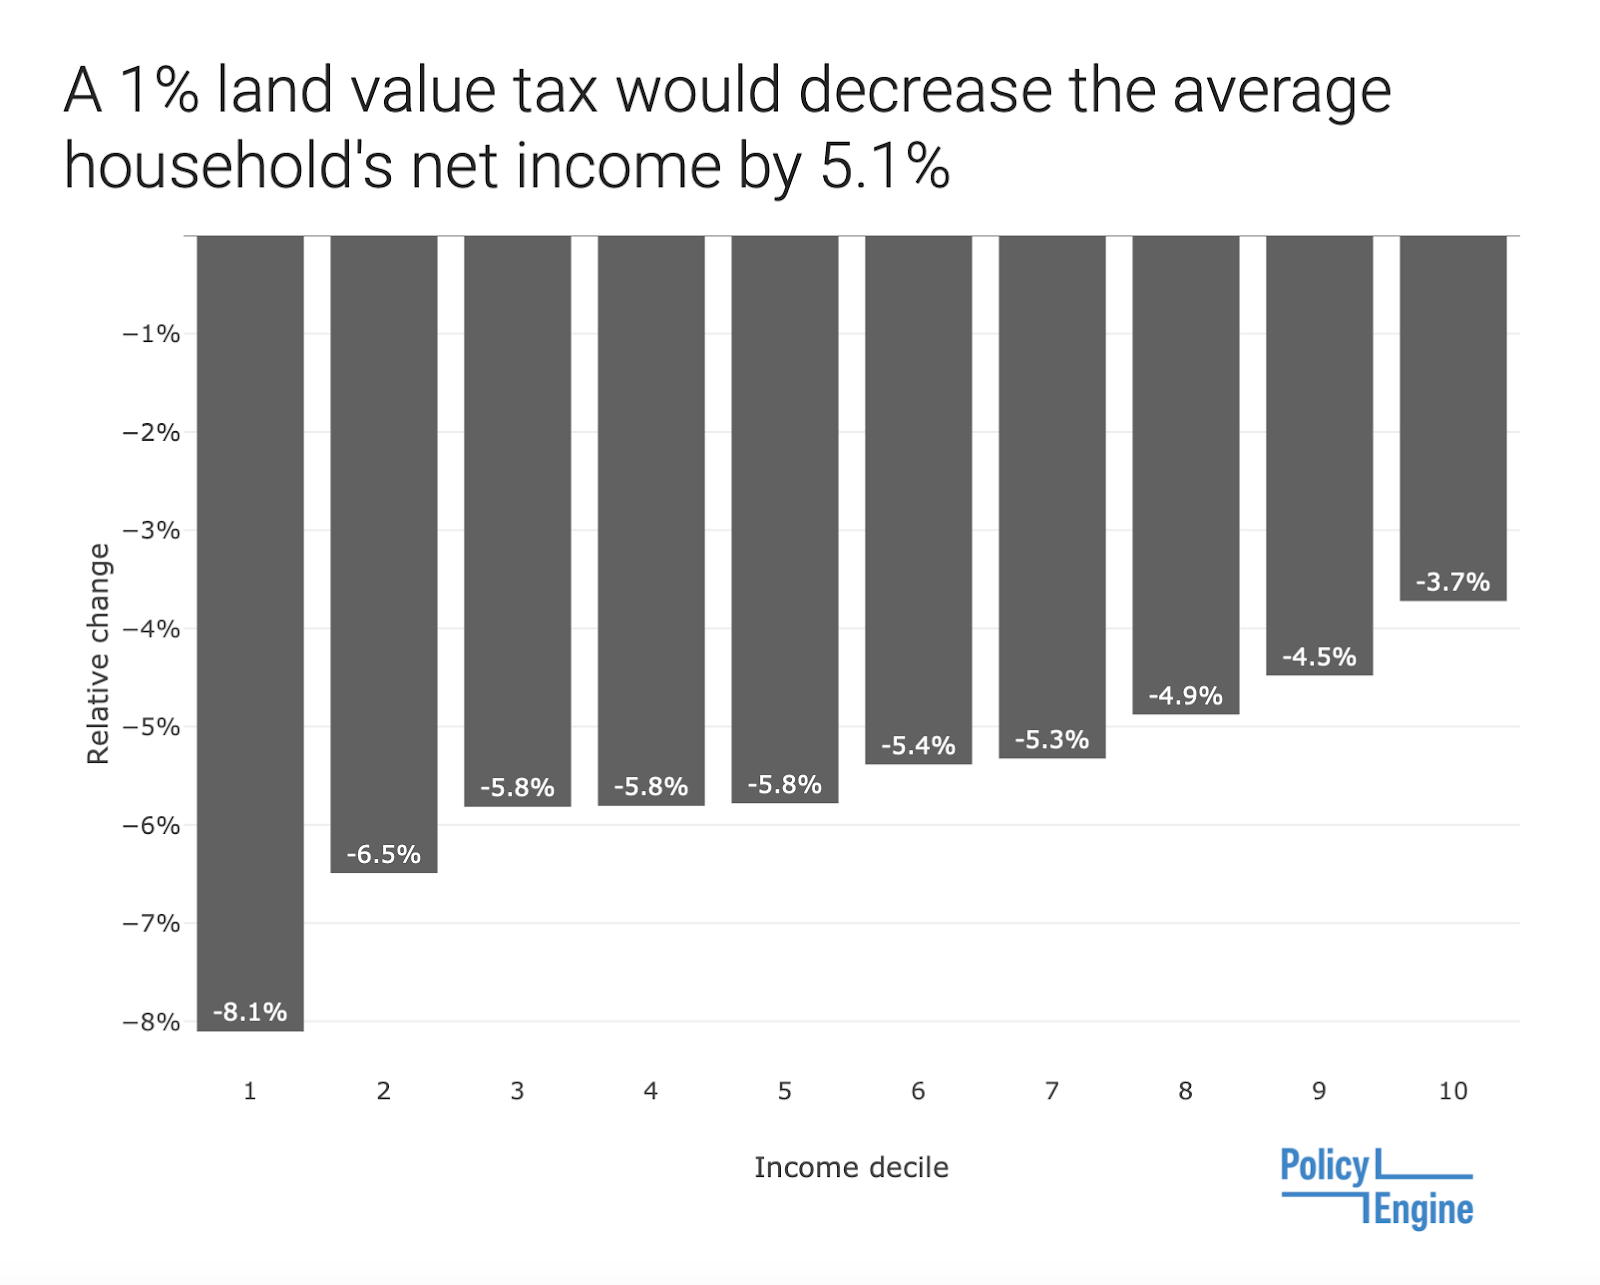
At 1%, the policy has a progressively increasing average impact by income decile in absolute terms, but lower income deciles see their income fall more as a percentage of income. This is largely due to households who might be considered ‘asset-rich, cash-poor’. (This might not occur if people respond to the tax by reducing their wealth, but PolicyEngine does not apply such behavioural responses).
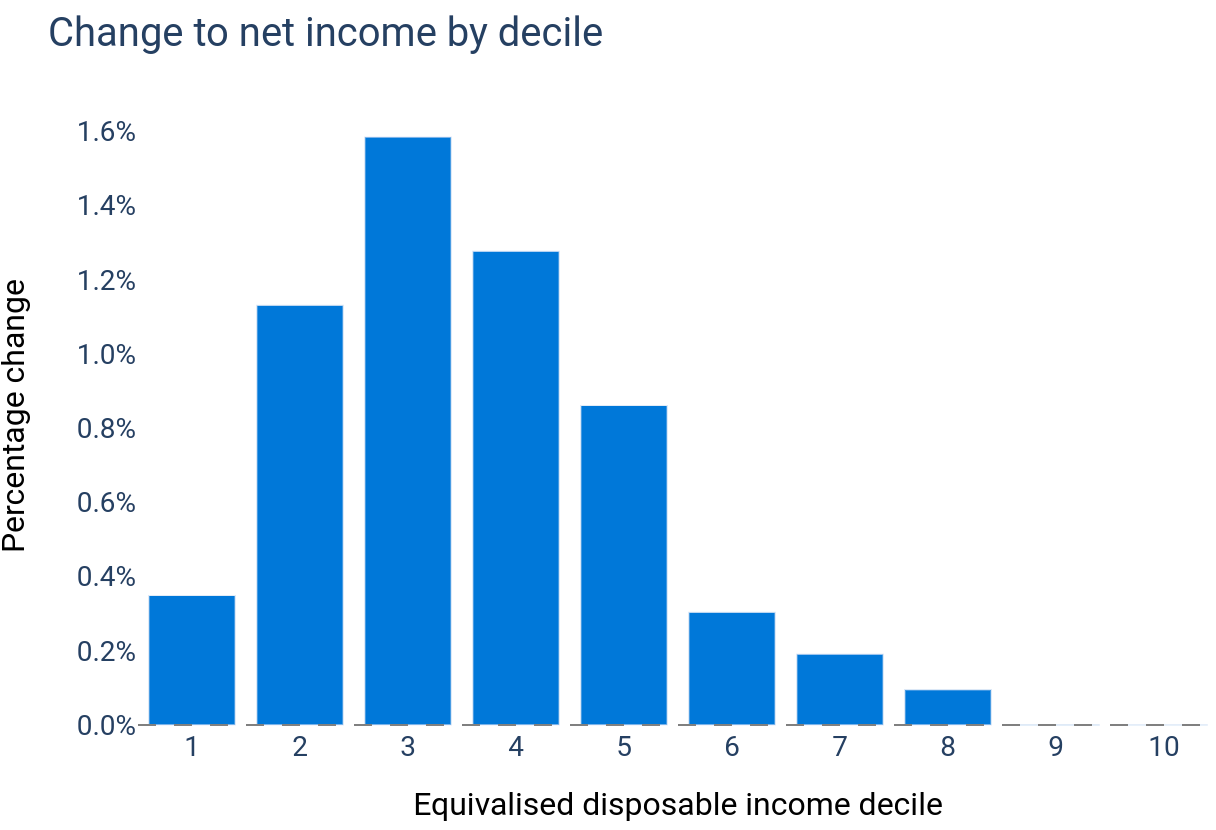
But if we look at the impacts by wealth decile, we find that the policy is progressive even as a percentage of income, and the bottom three deciles face no impact at all (rounded to the nearest 0.1%).
While decile averages are useful, they don’t tell us how mixed the outcomes were in each decile. For example, a policy might benefit most people in a decile, but have an overall negative impact if those were outweighed by a smaller number of households losing out — and this would look the same as a policy which negatively affected everyone in a decile to a smaller extent.
To see what’s going on inside the deciles, we can use the Outcomes by wealth decile chart. This breaks down each wealth decile, and shows the percentage of people who:
-
Gained more than 5% of their income
-
Gained less than 5% of their income
-
Experienced no change
-
Lost more than 5% of their income
-
Lost more than 5% of their income
For this policy, the chart shows a clearly increasing impact across the deciles, and reveals something more about the third decile: although there is no overall rounded impact, 14% of the decile experiences some small decrease in net income- just not enough to influence the overall decile average.
Understanding the impact of policy reforms on wealth as well as income deciles provides a more comprehensive picture of distributional effects. By incorporating this new feature, PolicyEngine UK enables users to see how different policy ideas affect people given their wealth. We encourage users to

nikhil woodruff
PolicyEngine's Co-founder and CTO

Subscribe to PolicyEngine
Get the latests posts delivered right to your inbox.
PolicyEngine is a registered charity with the Charity Commission of England and Wales (no. 1210532) and as a private company limited by guarantee with Companies House (no. 15023806).
© 2025 PolicyEngine. All rights reserved.