PolicyEngine's Spring 2024 update
How PolicyEngine compares to the latest external forecasts.
Contents
UK household outlook
Income Tax
National Insurance
VAT
Council Tax
Fuel duty
Universal Credit
Legacy benefits
Child Benefit
Pension Credit
State Pension
Appendix: senior poverty rates
Appendix B: modelling assumptions
The Office for Budget Responsibility's
This report contains a high-level and a detailed comparison of PolicyEngine's underlying model against government (principally OBR) and other third-party models.
UK household outlook#
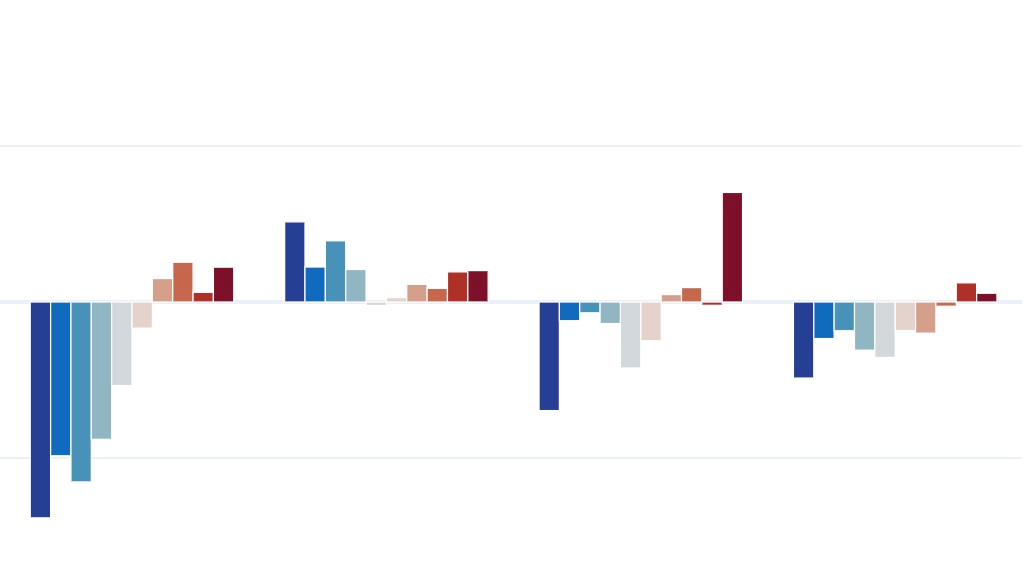
Figure 1: annual year-on-year change in real household net income forecast by decile
Figure 1 shows PolicyEngine's principal forecast for (real) household disposable incomes, up to and including calendar year 2027. In 2025, we project average relative increases in real disposable income for most income deciles, of between 0 and 3%. In 2026 and 2027, net income falls for most deciles, except for the top four.
All income measures in this report are before housing costs.
Figure 2: absolute poverty forecast by age group
Figure 2 shows the forecast for poverty rates (absolute, before housing costs): increases for all major age groups. With the exception of a reduction in pensioner poverty in 2023 (largely due to benefit increases), we forecast increases in absolute poverty rates for all age groups until at least 2027.
The
PolicyEngine replicates official forecasts closely, largely due to both calibrating some outputs directly to be consistent (making many of these comparisons - all but VAT and fuel duty - ex post), and replicating the use of the OBR's economic determinant forecasts. The next sections evaluate PolicyEngine's model forecasts against OBR forecasts for key programs. We also compare against UKMOD, developed at the University of Essex, using their latest (March 2024)
PolicyEngine’s calibration routine (specified in more detail in our
Income Tax#
PolicyEngine matches Income Tax revenue within 1% in 2024, with this accuracy falling to within 3% in 2027 as we project receipts to grow more slowly than the OBR.
National Insurance#
PolicyEngine underestimates total National Insurance receipts by around 6% in 2024, rising to 8% in 2027.
VAT#
PolicyEngine and the OBR match closely despite PolicyEngine not explicitly calibrating to VAT receipts. The difference is less than 1% in 2024 and 2025, and 2% in 2027 (UKMOD does not model VAT so is unavailable for comparison).
Council Tax#
We match Council Tax receipts closely (as does UKMOD)- Council Tax is imputed but relying on reported values by region (rather than simulated across local authorities), and all three models use the same OBR uprating forecasts to increase year-by-year.
Fuel duty#
Fuel duty is matched by around 10% on average, but is more volatile in PolicyEngine's model than the OBR forecast (UKMOD does not model fuel duty so cannot be used for comparison).
The deviation is likely caused by the fact that the OBR accounts for the impact of car electrification on revenues, unlike PolicyEngine which does not.
Universal Credit#
PolicyEngine's Universal Credit forecast is around 4% higher in 2024 than the OBR's, rising to 7.5% in 2027. This likely reflects uncertainty over the rollout of Universal Credit from legacy benefits.
Legacy benefits#
We match the OBR's forecasts for legacy benefit spending by around 7% on average.
Child Benefit#
We match Child Benefit spending by around 10% on average.
Pension Credit#
Pension Credit sees the most divergence between PolicyEngine and the OBR of all simulated programs: £3bn on average, which represents aroud 40% of the size of the OBR forecast. UKMOD also shows differences up to 40% (but lower overall). Given that Pension Credit affects the pensioners with extremely low incomes (whose data in the FRS is less reliable), this is an area for further investigation.
State Pension#
In 2024, we match the OBR on State Pension forecast within 7%, though this narrows to within 2% in 2026 and 2027.
Appendix: senior poverty rates#
We project a significantly lower senior poverty estimate for 2023 than HBAI largely because of our modelling of the Energy Price Guarantee. We modelled this as an increase to incomes, rather than a decrease in consumption. Figure 3 shows the senior poverty rate with and without this intervention.
Figure 3: senior absolute poverty forecast under alternative policy scenarios
Appendix B: modelling assumptions#
Both PolicyEngine and UKMOD face choices in how much to calibrate their models to administrative aggregates. These choices can involve inheriting calibration from the Department for Work and Pensions' (DWP) microdata calibration, applying uprating factors, and determining benefit take-up rates.
PolicyEngine has opted for a broader-scale calibration approach. We use optimisation techniques similar to those employed by the DWP when generating the initial Family Resources Survey (FRS) household weights. However, while the DWP primarily focuses on calibrating to demographic totals, PolicyEngine also includes statistics on tax revenues and benefit expenditures in the calibration process. Furthermore, we incorporate imputations from other surveys on income and expenditure to refine the microdata.
In contrast, UKMOD relies on the original FRS weights calibrated by the DWP to demographic totals, and limits adjustments to applying uprating factors and policy-related mechanical changes, such as transitioning households from legacy benefits to Universal Credit, adjusting unemployment status, and modelling benefit take-up rates.
While both approaches have their merits, we believe that microsimulation models should, at a minimum, strive to replicate the reported administrative totals for years where this information is known. PolicyEngine's more extensive calibration process aims to achieve this goal and improve the model's accuracy in estimating the impacts of policy reforms on UK households.
It is important to acknowledge that the level of confidence in projections may decrease for future years due to inherent uncertainties. However, calibrating the model to match known administrative data ensures a solid foundation for estimating policy reform impacts. Furthermore, we believe OBR projections are the best sources available for calibrating microdata in future years.
We recognise that the choice of calibration approach can influence comparisons between different microsimulation models. By providing transparency about our modelling assumptions and calibration methods, we hope to facilitate a better understanding of the similarities and differences between PolicyEngine and other models, such as UKMOD.
As we continue to develop and refine our model, we remain committed to striking a balance between model accuracy and transparency, while acknowledging the uncertainties associated with future projections.

nikhil woodruff
PolicyEngine's Co-founder and CTO

Subscribe to PolicyEngine
Get the latests posts delivered right to your inbox.
PolicyEngine is a registered charity with the Charity Commission of England and Wales (no. 1210532) and as a private company limited by guarantee with Companies House (no. 15023806).
© 2025 PolicyEngine. All rights reserved.