Beta-launch: PolicyEngine's enhanced microdata for policy analysis
By integrating and calibrating multiple datasets, PolicyEngine makes world-class tax-benefit microsimulation modeling available to anyone.

Contents
Motivation
Methodology
Prepare PUF for training:
Create PUF-structured CPS file:
Reweight with gradient descent:
Results
How you can use it
Future development
When policy analysts predict the effects of tax and benefit reforms, they often turn to microsimulation. By combining a rules engine with representative survey or administrative datasets, microsimulation supports intricate policy analysis at a detailed household level. Think TurboTax, but for hundreds of thousands of households at once, and over a range of policy rule scenarios. This technology is at the heart of tax-benefit analysis around the world—including PolicyEngine's.
Microsimulation's first ingredient is a robust rules engine. Here, PolicyEngine is well proven, with a detailed federal income tax model, state income tax models complete and
Today, we're beta-launching a significant upgrade to the second ingredient. Since
Our launch accompanies three topical reports leveraging the new data:
Child Tax Credit provisions of the Tax Relief for American Families and Workers Act (PolicyEngine)Individual income tax provisions of President Biden's 2025 Budget (PolicyEngine)Building a stronger foundation for American families: Options for Child Tax Credit reform (Niskanen Center)
This blog post lays out our approach, results from our validation dashboard, and our plans to further advance the field. We've also included information on how to use this free, open-source dataset in your own work, either via the PolicyEngine web app or locally.
Motivation#
PolicyEngine's broad policy scope creates special opportunities and challenges for microdata. Federal tax analysts like the Joint Committee on Taxation and the Tax Foundation have generally focused on data to support federal tax reform. Here, open resources like
Adding benefit programs and state taxes to the model, and reporting on other outcomes like poverty, requires a different approach. Tax returns lack the detailed person-level characteristics, hierarchical data structures, and information on benefits needed to capture the impacts of these programs. For example, Maryland limits its state Child Tax Credit to children under six, or those under age 17 with a disability—an intersection of signals not available in tax returns.
After introducing this approach to microdata enhancement to PolicyEngine UK
Methodology#
We construct our enhanced data, which we call the Enhanced Current Population Survey, or ECPS, from three sources:
Current Population Survey March Supplement (CPS). The CPS is a monthly nationwide survey that estimates unemployment rates and other key monthly indicators. Each March, the Census Bureau expands the sample and set of questions, to collect more information on the prior year among respondents. The March Supplement, also called the Annual Social and Economic Supplement (ASEC), powers reports such as official poverty estimates. Census releases the microdata and its results each September, so the latest currently available represents calendar year 2022. The data is hierarchical, with entities for people, families, tax filing units, households, and "SPM units", referring to the Supplemental Poverty Measure and representing groups of cohabitating individuals who share resources. The 2022 ASEC includes 146,133 people across 88,978 households.Internal Revenue Service Public Use File (PUF). The IRS makes a flat dataset with information on a sample of tax returns available to researchers who pay a fee and agree not to distribute the data. The most recent PUF represents tax year 2015, with179 characteristics for 207,696 records , statistically altered to avoid disclosure. From 2016 forward, the IRS will instead release asynthetic PUF, in partnership with the Urban Institute .- Administrative totals. For instance, the total US population, income tax revenue, dividends, SNAP benefits, and so on. We collect 92 of these from historical sources and Congressional Budget Office (CBO) forecasts.
Our procedure maps to the above sequence. As shown in Figure 1 (
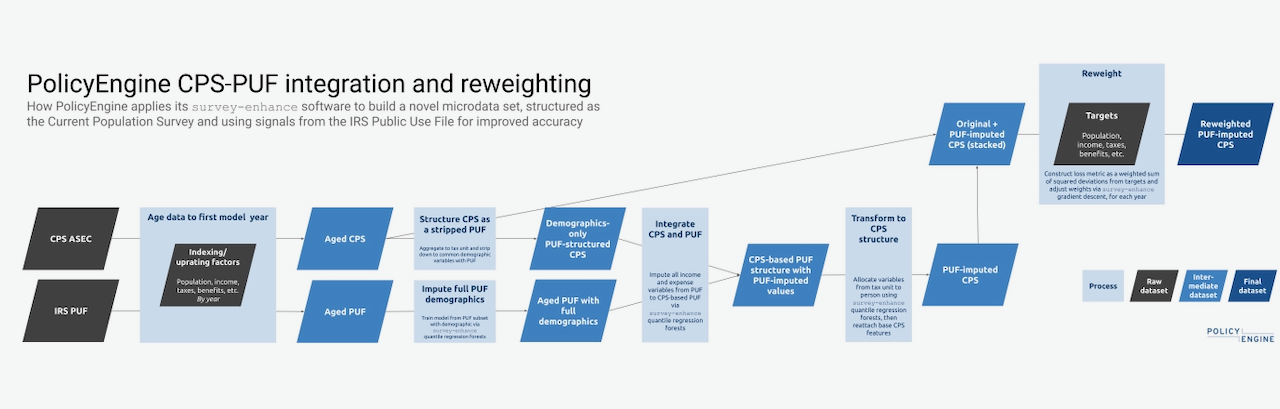
Figure 1: PolicyEngine's data flow to create PUF-enhanced CPS file
Specifically, here are our steps:
Prepare PUF for training:
- Select common variables: demographics, filing status, number of child dependents, and number of other dependents (NB: IRS caps dependent counts at 3 in PUF).
- Impute PUF demographics from the 119,675 records with demographics to all 207,696 PUF records using quantile regression forests.
Create PUF-structured CPS file:
- Aggregate CPS to tax unit to create a dataset with all common variables (includes transformations like capping dependent counts at 3).
- Impute PUF variables to PUF-structured CPS file using quantile regression forests.
- Break down the PUF-imputed CPS tax unit file by person.
- Attach other CPS characteristics to the PUF-structure.
- Stack the PUF-based CPS with the original.
Reweight with gradient descent:
- Calculate the deviation between the dataset's aggregates and administrative totals for each of 90 targets (population, income component, benefit participation, etc.).
- Construct a "loss function" that condenses these individual deviations into a single metric.
- Apply gradient descent to iteratively adjust the household weights to minimize the loss function.
We've built a new open-source Python package, survey-enhance
Results#
We've assessed our approach chiefly by comparing aggregates against administrative totals. We sum each of our 93x targets in the aged PUF, aged CPS, and ECPS, in 2022 to 2025 (applying our rules engine for computed targets). In almost every target, the ECPS performs best, coming within one percent of every target.
To see how our totals compare, explore our
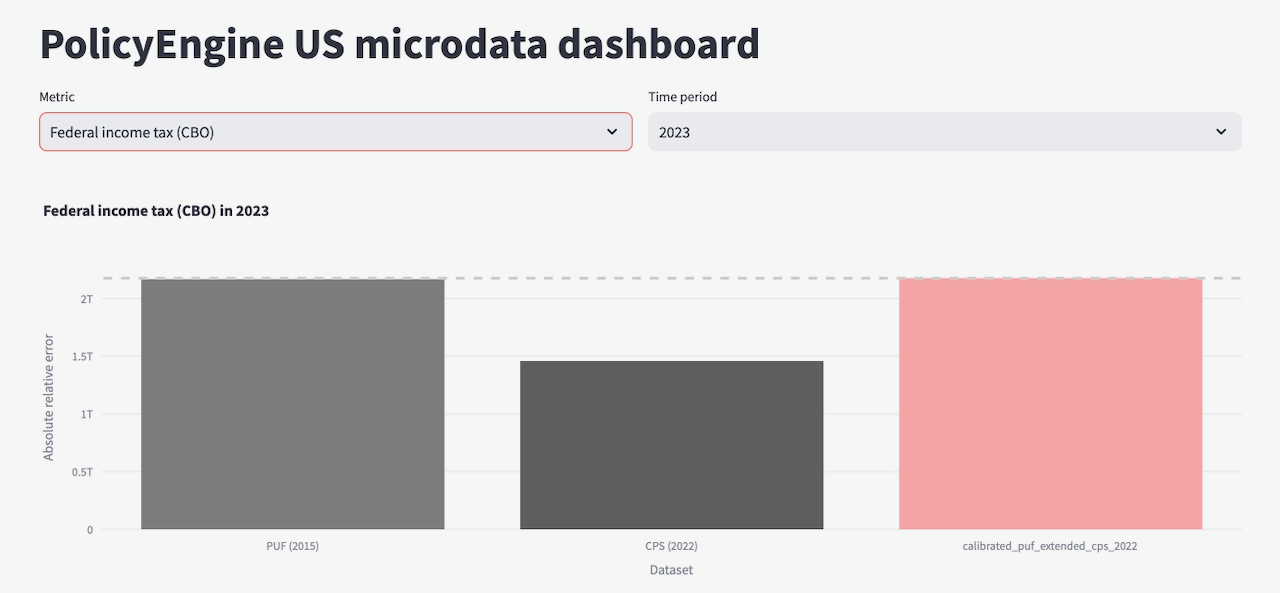
PolicyEngine's calibration dashboard
We have additionally compared results from reforms, and we will launch a similar dashboard with those comparisons in the future.
How you can use it#
You can use the ECPS in the PolicyEngine web app, in the policyengine-us Python package, or by downloading files.
To use the ECPS in the PolicyEngine web app, run a microsimulation as normal, and then toggle the Use Enhanced CPS switch in the right panel, or bottom on mobile. We will make this the default option after we exit beta, as it has been in PolicyEngine UK since we introduced the enhanced data.
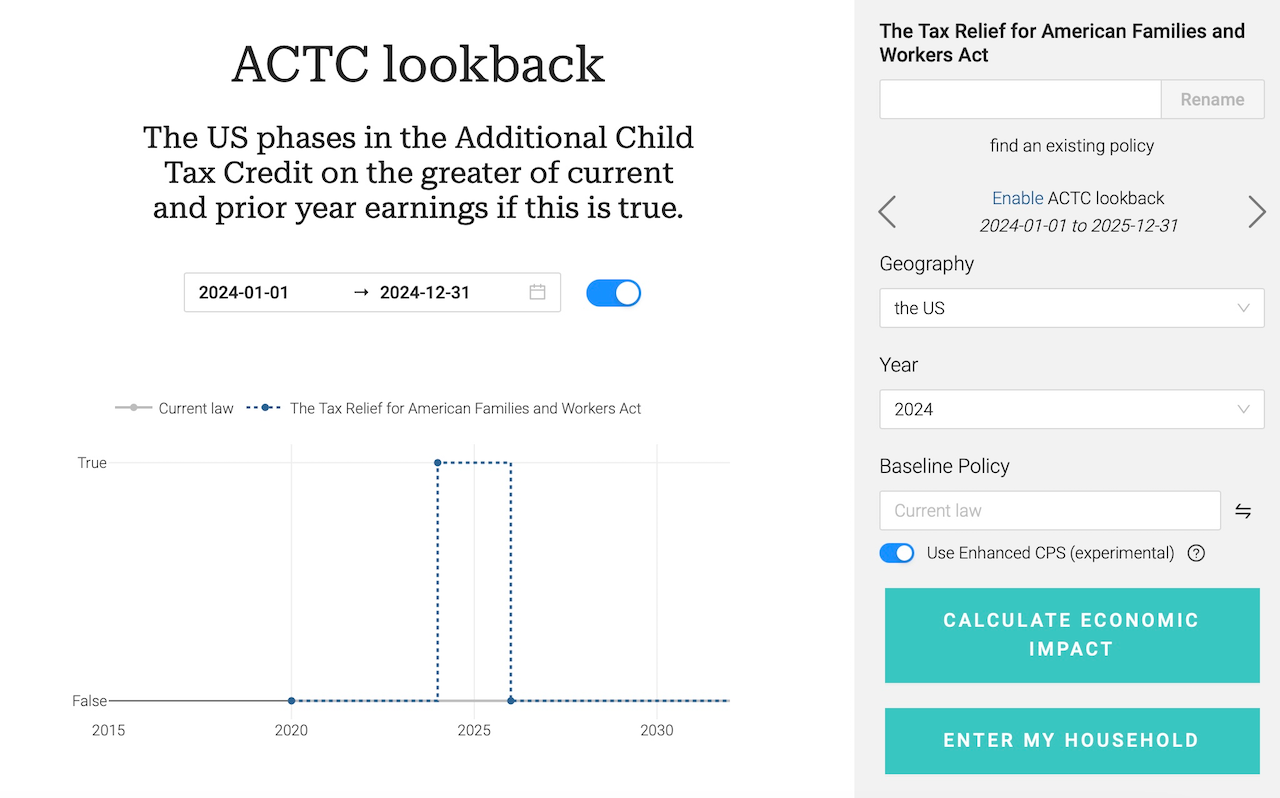
Enhanced CPS switch
To use the ECPS in the policyengine-us Python package, specify it in the Microsimulation call as follows, then use it as you would otherwise.
To download the ECPS, visit the
Future development#
We've received valuable feedback from many in the economics community throughout the development process, and consider this launch only the beginning. Our plans for future development fall into four broad categories:
- More targets and validation. As of this writing, we have
39 open issues related to calibration , ranging from adding targets to better aligning our definitions to available targets. - Comparison to other models. For instance, we are currently working with the
Policy Simulation Library to validate this dataset against their PUF-basedTaxData project. We are also collecting estimates from other analysts, such as the Joint Committee on Taxation, Congressional Budget Office, Tax Policy Center, and ITEP, to compare projected results of reforms. - Integrating more data. Beyond the CPS and PUF, we would like to integrate information from other sources. For example, assets from the Survey of Consumer Finances would improve our modeling of asset limits in programs like SNAP and SSI; consumption from the Consumer Expenditure Survey would enable modeling of a hypothetical Value Added Tax or carbon tax (
as our UK model has ); and rent expenses from the the American Community Survey would improve our modeling of state rental tax credits. - Finer geographic detail. Having calibrated our data to the US as a whole, we are equipped to replicate the process for smaller geographies. We will avoid the issues of small sample sizes by reweighting the full nationwide dataset to each local area's administrative targets—starting at the state level, then Congressional district and ultimately state legislative district or other locales.
We are setting new standards in policy simulations and evidence-based policymaking by enhancing the CPS with IRS tax records and reweighting. Our ongoing innovation and transparency align with PolicyEngine's mission to compute the impact of public policy accurately and objectively.

max ghenis
PolicyEngine's Co-founder and CEO

nikhil woodruff
PolicyEngine's Co-founder and CTO

Subscribe to PolicyEngine
Get the latests posts delivered right to your inbox.
© 2025 PolicyEngine. All rights reserved.